The prices of options are constantly changing. The underlying stock goes up and down, general market conditions change, and the time value of any options diminishes each day.
Many years ago, traders began to assign Greek letters to various aspects of options values. Theta, Delta, Beta and Vega are the ones used most often in the HOT Trading System.
Don't worry--there's no difficult math involved! If you can ADD, SUBTRACT, MULTIPLY, and DIVIDE, then you'll get it in no time. You just need to know how to find the important information on your thinkorswim platform.
Time means money, and sellers of options have to consult the length of an option when pricing it. If you take the total value of an option and divide it by the number of days until expiration, you end up with a number we call THETA. The Theta of an option is the rate of decay of an option's time value and is measured in dollars.
Here's some examples:
- If you bought an OTM option worth $2.10 and it expires in ten days, then your theta is an average of $2.10 X 100 shares / 10 days or $21 loss per day.
- If you sold an OTM option worth $2.10 and it expires in ten days, then your theta is an average of $2.10 X 100 shares / 10 days or $21 gain per day.
Of course, these are averages, and the actual amount each day may vary.
In the HOT Trading System, theta is one of three major tools of wealth creation. Although both intrinsic and extrinsic values of an option are important, it is theta which is certain to decay, creating profits for us, while delta may go up and down over time and as prices change.
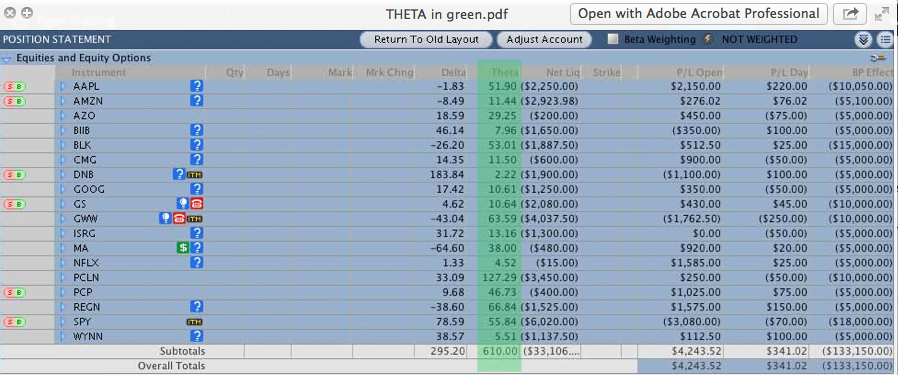
In this screenshot of an account, you will see the theta marked in green.
You see the amounts of theta for each position, and the total which is 610. This means that at current prices, the account is growing at $610 per day. If we were mostly buying options, this would be a negative number (not good!).
FACTS:
- New options are generated by the computers, usually at least 6 weeks ahead, on the first Monday after expiration and are then at their highest value.
- The time value of always decays in value until it stops at zero.
- The longer until expiration, the greater the theta.
- Theta is calculable per day as trade cost or credit divided by number of calendar days.
- Theta is reported in Monitor/Activities and Positions/Position Statement on thinkorswim.
- OTM options are all theta.
- ITM options have quite low theta % of their total price, as most is intrinsic value.
- ATM options have a mix of the two.
- This is true whether we are talking Puts or Calls.
So that's the primer on Theta. During the time you've read this blog, did the remaining Theta in your account go up or down? Hopefully you made money with time decay!
You think AAPL is going to to go up. You decide to use Call options. But which one should you buy? How much will you make if the price goes up?
Lets look at the option chain and discuss two possibilities.
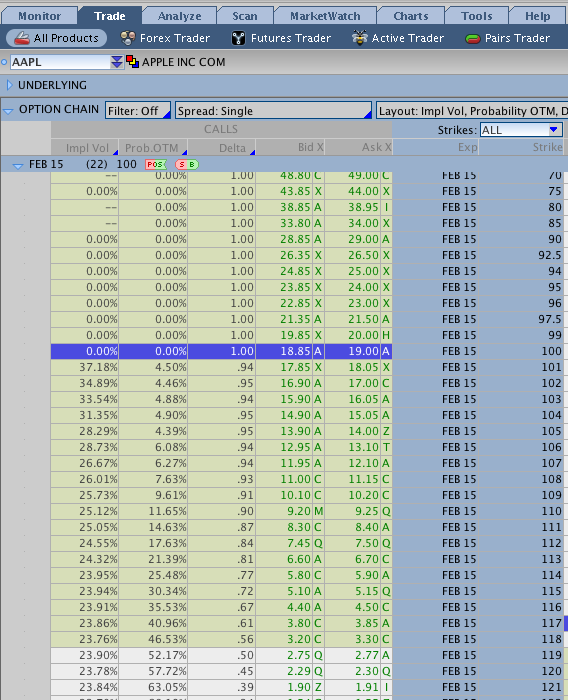
 Here you see the Call option chain with the strikes listed on the right. The ones in gold color are "in the money" and those in the white area at the bottom are above the current price, or "out of the money". In the middle you will see a column called "Delta".
FIRST POSSIBILITY: Let's say, its January and you predict that the price of AAPL will rise to at least $130 by February expiration, so you decide to buy AAPL Feb Calls. You see that AAPL is currently priced at about $118. If you look in the middle column, you see "Delta" and can find the February 118 Call. The asking price for the ATM Call (118) is $3.30 and the delta is .56. That means that each contract (100 shares) will cost you $3.30 to trade, and when the stock goes up, the option will begin to move at 56 cents (the delta) for every dollar the price of AAPL goes up,.
SECOND POSSIBILITY: However, what if you wanted to make $1 for every dollar the price goes up, like real stock? If you think the price will go over $120 by February, then you could buy the Feb 100 strike with a delta of 1.0 and control 100 shares for $19.00. Then if AAPL goes up $1 you sell and make $1. You could also buy two 118 Calls at a delta of about .50 each, for a total of 1.00. Then you would also get about $1 for each dollar rise in the stock price.
SUBSTITUTE FOR STOCK: But what if you wanted to substitute options for stocks? Can you match the value of your Call option to that of the stock price? Yes, look above and you'll see that the 100 Call has a delta of 1.00 (highlighted in blue). Owning the 100 Call is just like owning the stock. You get about a one-for-one movement in value (and save about 80% on the cost.). To get an option that mimics the action of the actual stock, you need a deep-ITM Call or Put. The further out-of-the-money your option, the lower the delta, or the less it reflects the actual stock price.
Similarly, if you think the price of AAPL will go down, and you want to take advantage of that move, you could buy a Put options with a delta of -1.00, meaning that your Put will increase by 1.00 cents for every dollar the price goes down.
To match the delta of stock (always 1.0), you can mix and match deltas. For example, three Puts at a delta of .33 will give you about the same as stock, or as two ATM options.
SO ..... Delta is the rate of change between the price of a stock and a price of an option. It includes the total price, including both intrinsic and extrinsic elements such as time value and volatility.
FACTS:
- All Call options have an absolute delta between 1.0 and 0.
- All Put options have a delta between -1.0 and 0.
- ITM options have a delta between 1.0 and .50. (- 1.0 and -.50 for Puts)
- OTM options have a delta of less than .50 (-.50 for Puts)
- Sum of the delta of the Call plus delta of the Put at the same strike and expiration is always 1.00.
- If you want to own an option that will behave like the stock, then you need to buy a Call option with a Delta of .9 or more. If you want an option that acts like shorting the stock, then buy a Put option with Delta of -.9 or more.
- Many traders recommend using options with a delta of at least .7 (that's -.7 for Puts) in most directional trades. Anything less you don't get enough return for your risk!
EXAMPLES: A July 50 option of XYZ stock with a delta of .75 would always be an ITM Call. An April 160 option of any stock with a delta of -.35 must always be an OTM Put.
So now you know what delta is, how to find it, and some ways to use it.
Let's move on to the third Greek . . . .
Our third Greek, Beta is the standard measure of volatility of an individual stock against the general market. It can be derived by comparing the price action of a stock with the general market. In the USA, the SPY index is considered a general standard and is given a Beta value of 1.00, and all other stocks can be compared to it.
EXAMPLE: If PCLN has a beta of 1.4, that means the stock is 1.4 times more volatile than the general market. If WMT's beta is .39, that means it moves only 39% of the overall market.
However, there is much more to know about Beta. In fact, the real story is what the numbers mean. S here's my guide to understanding Beta:
If the Beta is it means
1.0 same volatility as market
>1.0 more volatile than market
<1.0 less volatile than market
0 price action unrelated to market
-1.0 price action is contrary to market
To find the beta of any stock on thinkorswim, simply open the Trade Tab and type in the symbol in the box. Then click on the two arrows to open up the two rows of basic information. You'll find the beta listed on the far right side. [click to enlarge]
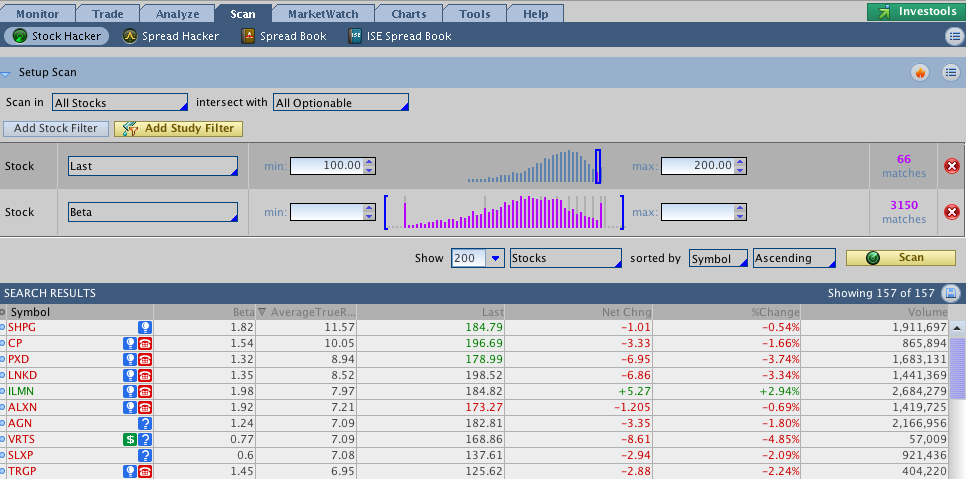
To search for stocks within any range for beta, set up and select the Scan tab [click to enlarge]:
Here I've scanned for stocks between 100 and 200, and then sorted by Beta-ness. I also added a column for ATR (Average True Range) so we can compare to the Beta value. You can adjust the parameters on the Price Range and Beta functions to narrow down or wider your search. For example, if you are looking for stocks with higher beta ( >1.3 ) then you will find lots of them right here. Just move the sliders and hit Scan to make your selection.
Because the HOT Trading System prefers higher premiums when we sell puts and calls, then the Beta function can help us find stocks that generate more premium. Generally we prefer stocks in the range of .7 to 1.7, as they are close to or a little more volatile than the general market. Stocks with Beta above 2.0 may be too volatile for beginning traders. However, during market downtowns, stocks with a beta around 0 to -1 can act as hedges against loss.
It is important to match beta to the correct strategy. Strategies which rely on price stability will not work as well on stocks with higher beta (above 1). Try using beta around .5 instead.
FACTS:
- Beta can be measured for individual stocks, baskets of stocks, and the overall market.
- Beta is compared to the SPY which is always 1.
- Many pharmceuticals move irregularly and therefore have low betas.
- There's a lot more to learn about Beta, so if you want to jump in the deep end, start here.
Find the beta for the following stocks: SPY, AAPL, AMZN, GOOGL, STMP, FB, HD, ULTA, MELI, MSG, TSLA, BIIB, GE.
Fourthly, Vega is actually not a Greek letter at all, but a measure of the overall volatility of an individual stock, compared to itself. (It just sounds Greek--or a not-very-popular General Motors sedan from the 1970's.) Rather than measured against the SPY, the volatility of a stock is measured against itself. When a stock approaches earnings, for example, its Vega increases and then suddenly decreases upon release of the earnings--like air out of a balloon. This deflation can be measured.
EXAMPLE: In the two weeks before its recent earnings announcement, the cost of AAPL at-the-money options rose about 50%. After the announcement, the value of these same options dropped about 30% near-the-money and by 75% three strikes out. These changes occur because investors are willing to pay more for most options just before an earnings announcement, and less after the announcement.
Go to the AAPL option chain under the Trade tab. Look at all the "Implied Volatility" numbers for upcoming weeks. Which one is highest? Why is this? Choose the weekly option for the next AAPL earnings announcement and the one after that. Sell the ATM Put option for the week of earnings, and buy the ATM Call option for the same week.
Now that we've covered these Greeks, in a future class we will discuss how the implied volatility of an option is measured and how you can use it.
+++++++++++++++++++++++++++++++++++++++++++++++++++++++++++++++++++++
Now here's a simple 10-part quiz . . .
All rights reserved. Copyright 2016-2018 Honolulu Options Traders, LLC.
So now here's your homework, using the PaperMoney account on your TOS platform. If you want help, contact your partner or go on HOT OPTIONS chat on Facebook. Time required: 2 hours.
On TOS PaperMoney, purchase the following positions, which require a knowledge of how delta works:
- Buy 1 AAPL Nov 160 Call, and 1 AAPL Dec 160 Put. How much did that cost? What was the delta for each? Which ones are ITM, OTM or ATM?
- Buy 1 Nov MSFT 55 Put and sell 1 MSFT Nov 50 Put. What strategy is that? How much did that cost? What was the delta for each? Is the overall position OTM, ATM or ITM?
- Buy 1 AAPL Mar Call with a delta of .7 and I AAPL Mar Put with a delta of -.3 How much money did that complete transaction cost? Place closing orders to sell each one at double the cost.
- Buy 1 IBM Dec Put with delta of approximately -.90 and Sell 1 Dec IBM Put with a delta of about -.60 as a vertical spread (one trade). What was the cost? Place an order to close the vertical spread with 20% profit.
- Buy 2 Jan PLCN options, each one approx. $50 from the current price, one a Put, and one a Call. What strikes did you use, and what was the cost of each? What was the delta of each? What strategy is this? Place orders to sell each leg separately, with 50% profit for each.
- Buy 2 GOOGL options for Jan, one with delta of .30 and one -.30. What strategy is this? Place orders to close each when it is 20% profitable.
The following require you to understand theta and how it works.
- Buy 1 SPY Mar 250 Call and 1 SPY Mar 260 Put. What is the overall theta of the position? (Hint: look in your monitor tab/position statement) Place separate closing orders for the Puts and Calls at 120% of the purchase price.
- For TSLA, sell 1 Dec ATM Call option, and 1 Dec ATM Put option, one contract only. Look on the monitor tab and discover the theta generated by this trade. What is the overall cost or credit? What is your potential ROI? Go to the Analyze tab and review the trade's profile. Where are the break-evens for this overall position? Place an order to close (buy) the Puts and Calls separately for .10 cents
If any of this is puzzling to you, then go on the HOT OPTIONS chat on our Facebook page and ask the folks there!


