 When the market appears uncertain or volatile, such as during earnings season, individual stocks may represent higher than normal risk. Summer is often such a period, as volumes drop off and traders and investors turn their attention to vacations, travel and family. Earnings periods, which occur four times per year, usually increase risk on individual stocks. A safer way to trade during these riskier periods is with SPY and other indexes such as RUT, IBB or SPX. In this post, I suggest how to best set up your trades for minimal risk and maximum profit.
Home on the (Trading) Range
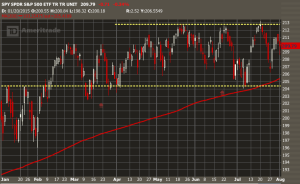
Currently [early August, 2015], the market for SPY is trading in a narrow range from about 212.50 (high) to 204.50. Each month or so, it oscillates from "overbought" to "oversold," retreating from an apparent glass ceiling around 213. How low it goes depends on the news of the week. The recent "Greek" crisis saw the SPY hanging around the 205 mark before it headed back up to test the highs again. So far this year, the SPY has not closed below the 200-day MA (which normally occurs only in a recession). September often sees the lows for the year, so we are sure to test support at the 200-day MA. When it does, traders will need to consider if this is due to changing economic conditions or by isolated news events. 
As there is no news now that could push the Dow even higher--such as an unlikely Fed announcement that interest rates will stay low forever!--this oscillation could continue for several more months. But anyone can see that the Index moves up, then sells off, then goes lower, then turns around and goes up agin. We see swinging from highs to lows and back , and swing trading is the way to capture maximum profits!
Selling Calls ... above and below the market
Each time the market has hit new highs recently--the SPY around 212--it has sold off. Volume drops and prices follow, as investors believe they can buy again at lower prices. Notice the series of highs around the 20th of each month! This means that about once a month, the charts have told us to sell Calls above the market.
THE TRADES:
- Sell OTM Call at 215 with a credit of $1 or more and buy back much cheaper when the price has dropped. You will begin to lose money only if the price closes above 216 at expiration.
- Sell ATM Call at 210-212 with a credit of $2 or more, and buy back when the SPY drops to 208 or less. Only if the price closes above 212-214 at expiration will you lose money.
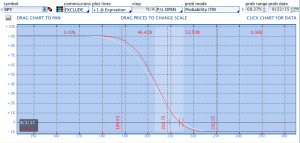
- Sell DITM Call at 200 with another Call close to the money. Hold until September expiration or until September sell-off is over. Loss is limited to distance between strikes minus credit collected.
 EXAMPLE: Sell Sep 200 / Buy Sep 210 Calls for a credit of 9.34. Your risk for this DITM trade is only 0.66 or $660 for 10 contracts. You can adjust the strikes and number of contracts to suit your maximum budgeted risk. If the overall market slumps, your profit will be several thousand d0llars. Heres the trade on TOS's Analyze Tab:
Selling Puts ... below and above the market
Swing trading means moving from puts to call, or bullish to bearish, over the space of a week or two. Time comes to sell OTM Puts, as the SPY runs or even gaps up and continues on toward its recent highs. Similarly, when the SPY starts up from the low end of the range, place the DITM Put spread, selling 220 Oct Puts and buying insurance using Puts at 206, 208, 210 depending on your budget. You goal is to close out the trade when the SPY gets up close to record highs again or when volume drops. The ideal place to do this is when the SPY is moving up with confirmations (gap, high volume, away from the 200-day MA).
EXAMPLE: Sell Oct 220 / Buy 210 Puts for a credit of $8.80. Your risk for this DITM vertical trade will be $1.20 or $1,200 for 10 contracts. You can adjust the strikes and number of contracts to suit your maximum budgeted risk. Then close the trade near record highs on the SPY.
How to do the SPY trades with reduced risk
If you plan to engage in the DITM Call spread, you have a risk of $0.66 or $660. But this cost can be dissolved by adding an OTM Call spread to the DITM Call spread. Simply sell enough Sept 215/200 Calls to raise $0.66 or $660. Keep in mind that you don't eliminate all risk with this double trade--you just shift it north to the space above about 215.
Similarly, for the Put spreads, when the SPY is heading up, sell enough OTM Puts (say 204/202) to generate $1.20 )or ($1,200). Your risk has now been moved to the space below 204, and anything north will mean thousands in profit. The trick is in the combination trade, adding an OTM to the ITM trade, to create trading success.
Timing the Swing ... the most important part!
Don't forget to leg-in to these trades. Although swing trades can be treated as halves of an Iron Condor, they usually don't start out that way. Use the same expiration if possible, however, as you can use the same margin amount for each side. At times, you may hold Puts and Calls for the same expiration month or week, but starting start out that way is only useful if you trading a WWIC (wide-wing iron condor).
The time to put on these trades is when the SPY is heading away from your sold OTM strike and toward your sold DITM strike. If SPY reaches a cyclical peak every two weeks, you should expect to place your Puts and Calls about ten days to two weeks apart. More about this next time.
UPDATE : In the recent August meltdown, our swing trade strategy worked very well. Traders had deep ITM Calls in place and closed them out when the SPY reached the goals set by traders, creating big profits. SPY is now in a new trading range 0f approximately 192-202.
UPDATE Dec 2015: SPY is now in a new trading range 0f approximately 200-210. Each time the SPY drops below 202, we have placed orders for a DITM Put spread, expecting the index to rise again.
Now go to Part 2, where I discuss the "middle ground" of the Swing.
Copyright © 2014-2016 Honolulu Options Traders, LLC.
All rights reserved worldwide.


