The TOS "Charts" do not have a "gap" function like Prophet does.
However, you can use this custom script to show "gaps":
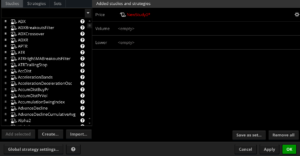
- Open Charts/Edit Studies. Select "Edit Studies" and press the "Create" on the lower left.

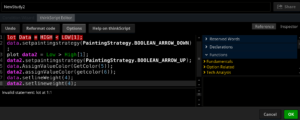
- Paste this script into the box:
Plot Data = HIGH < LOW[1];
data.setpaintingstrategy(PaintingStrategy.BOOLEAN_ARROW_DOWN);
plot data2 = Low > High[1];
data2.setpaintingstrategy(PaintingStrategy.BOOLEAN_ARROW_UP);
data.AssignValueColor(GetColor(5));
data2.assignValueColor(getcolor(6));
data.setlineWeight(4);
data2.setlineweight(4);

3. Press Save
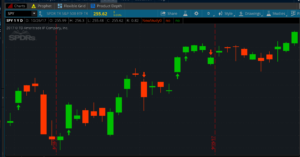
4. Enter a new stock Symbol and you should get a screen like this, showing up and down gaps.
Copyright 2017 Honolulu Options Traders, LLC.