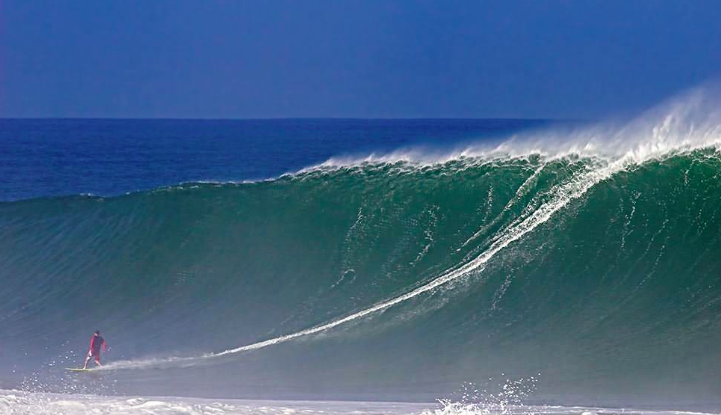
Surf's up! Been to Pipeline or Sunset Beach on Oahu's North Shore to feel the power of the big Pacific rollers coming in from the north? Regardless of currents, the sinusoidal action of the wave generates little forward motion, translating energy instead into a lifting of the wave, followed by a falling. Whether the break goes right or left, the ride comes from the height of the swell, not the depth of the water. A flat ocean, subject to offshore breezes, has a small swell, and is no fun to ride. Overall, the surf is a sign of the overall energy of the ocean, but it is a great metaphor to understand volatility in stock and options trading (Check out these fab left hollow rides. )
General Market Volatility
I want to use the language of ocean waves to talk about volatility in stock and options trading. It is one of our key strategies and a consistent profit-maker. A few times a year, the market gets more volatile than usual, just as the swell creates bigger surf. As measured by the VIX, the last two years have seen more than ten of these spikes, usually coinciding with brief downturns in the market. They 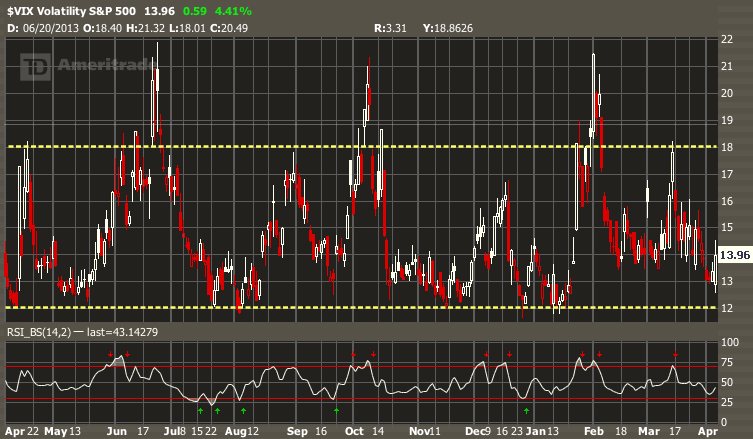 sometimes accompany the quarterly earnings season, sometimes not, and can be caused by unexpected economic news, political crises, or impending war. The public gets anxious about the future, and stock holders fear that their stocks will tumble. Traders and institutions purchase Puts to protect their investments, driving up premium prices.
ACTION: In TOS, go to Charts/Prophet and type $VIX and show YTD. Place horizontal lines at 12, as we all as at the 16 and 20 level. Where does the VIX spend most of its time? How times in the last year did it spike above 20 and stay there for more than a day or two? How often did the VIX go under 12?
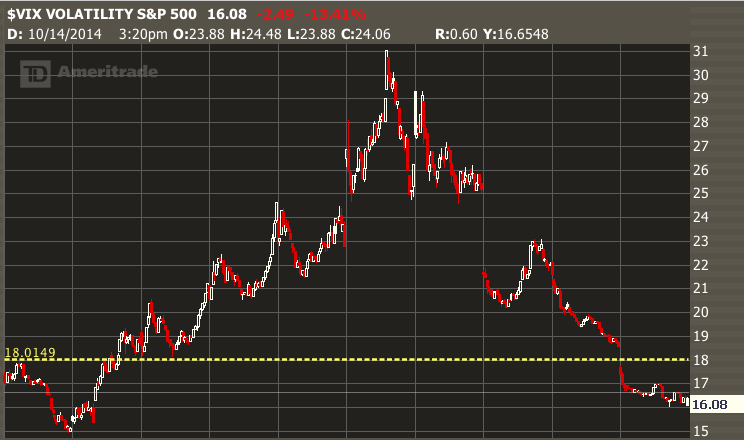 Here's the VIX for a recent high volatility period [October 2014], showing how symmetrical these periods can be. A score of 30+ on the VIX was achieved because of the coincidence of unrelated factors: the peak of earnings season, the ebola scare, and threat of war in Ukraine. Notice how the volatility then dropped just like a wave crashing! The higher the VIX went, the less time it spent up there, making this volatility event rather predictable and very tradable.
The good news for traders is that when this happens, almost all options premiums go up in value, both Puts and Calls. Just as a high tide floats all boats, most stocks participate in a general rise in option premiums. Historically, for every 1% drop in S&P 500, VIX index moves 1.3 points, according to Blackrock's analysis. When the VI goes up, its a chance for savvy traders to get an edge and to make up for the rest of the time, when the market is rather flat.
As sellers of options, we love these periods, because they provide an opportunity to sell premium at higher prices. We then wait until the market settles down and buy it back. And it always does. Its a pattern that consistently generates big profits, even if prices on average go nowhere at all. Successful traders learn not to fear market pull backs for the same reason surfers like big waves--you can develop the skill to ride them and become a champion! High volatility means bigger profits from the sale of premiums.
ACTION: Type in $VIX in your one-year chart and then draw horizontal lines at the high and low for the VIX over the last year. What was the high? When was the least volatile period of the year? What is the VIX now?
How to Trade General Market Volatility
Strategy The tools we use to analyze and trade general volatility are the VIX and VXX, along with general market indexes SPY and SPX. You can trade both VIX and VXX directly, but strategy is very important because the prices of these options look different from all others. (To know why, look up "contango" in Wikipedia or watch this Tasty Trade video.)
- Selling premium when the VIX is high. We lightly sell OTM Puts and Calls on the SPX or SPY when the VIX goes over 16 and buy them back
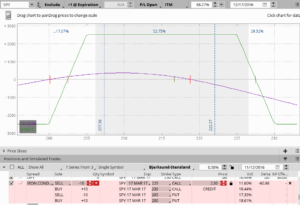 when it reaches under about 12. Our favorite tool is the Wide-Wing Iron Condor. Here is one placed during the 2016 election when the VIX was about 20.
 - Buying Vertical Call Spreads. You can trade the VIX directly using VIX and VXX. There are no exact replicas of the VIX but many products by Barclay's Bank and others have been developed to mimic the VIX. (For more try this site.) Buy the VIX at any close strike when it is very low (under 12) and sell a higher strike, expect it to rise during next earnings season. A favorite time to do this is the day or two before earnings season starts (using Alcoa or AA as the starting stock).
Warning! Unlike regular stock options, where a "natural" value is easy to establish based on probabilities, VIX and related options are highly skewed toward the mean. This is because everyone knows that the VIX will always go down after it goes up and go up after it goes down, and all within a defined range.
ACTION: Watch these videos on Youtube on the topic until you understand how it works.
- CBOE on the VIX
- how to trade the VIX
- tom sosnoff on how to trade low volatility markets
- using the VIX to trade directionally
Periods of Low Volatility
Episodes of high volatility are followed by periods of descending and lower volatility. The markets calm down, and the Average True Range (daily range) of stocks drops. When this occurs, option premiums of soon-expiring options will drop in value even faster than normal. Looking at the chart above, you can see that the VIX will descend to 12 or even lower during these calming periods. However, you can also expect volatility to return soon, as very low VIX numbers and low premiums are also sign as of possible reversal in the market.
Starting at the end of 2017, the US markets went into a period sustained of low volatility, as stocks frequently went to new highs. With the VIX often ranging between 12 and a low of about 9, it was challenging for traders. In such conditions, they preferred Iron Condors, Iron Flys and Butterflies--all of which do well when the market is stable.
For more on low volatility trading, check out Tasty Trade's video (2017) and also http://etfdb.com/type/investment-style/low-volatility/
Trading Volatility of Individual Stocks
Now that we understand something about general market volatility, let's imagine that options prices of individual stocks reflect this factor. There are four important terms to understand.
To begin with, you will remember the discussion about Beta, one of the Greeks. This number compares the volatility of any stock to the general market (as per the SPY) and is based on historical prices. The higher the Beta number of a stock, the more expensive premiums will be. You find it by opening the Trade tab and then click the Underlying, and looking to the second row, extreme right:
The volatility of the overall market is always considered to be 1 or reflect the SPY. Each stock also has a volatility history. Sometimes stock prices are flat, sometimes they trade wildly. The first thing I look at, after checking the charts for range and trend, is the Beta on a stock. Investopedia asks readers to
"think of beta as the tendency of a security's returns to respond to swings in the market. A beta of 1 indicates that the security's price will move with the market. A beta of less than 1 means that the security will be less volatile than the market. A beta of greater than 1 indicates that the security's price will be more volatile than the market. For example, if a stock's beta is 1.2, it's theoretically 20% more volatile than the market."

[click to enlarge]
You'll see TSLA's Beta rating at about 1.19, which means that it is a little more volatile than the S&P 500 (as measured by the SPY).
Secondly, the value of any option also contains a implied volatility factor, or "IV" and known by financial engineers as Sigma. If hardly any volatility expected in the near future, then the implied volatility of a stock will be low. However, if earnings are coming up, and the stock typically moves a lot at that event, its IV will be high. If an option is for a close monthly expiration, then its IV will be lower than for a far out month, as it has less time to wander. The IV does not tell us which way a stock will move!
Its a complex formula, but its really that simple! Here's the Investopedia definition:
"The estimated volatility of a security's price. In general, implied volatility increases when the market is bearish and decreases when the market is bullish. This is due to the common belief that bearish markets are more risky than bullish markets.... In addition to known factors such as market price, interest rate, expiration date, and strike price, implied volatility is used in calculating an option's premium."
ACTION: Open your Trade Tab and type in SPY. Select single and then find the IV column on your options chain. Also look to the most right and you will see the expected move of a stock (e.g. +/- $34).
Thirdly, AVERAGE TRUE RANGE or ATR indicator measures the difference between the highs and lows of a stock each day. The ATR is not the same as Beta, but a measure of how much a stock moves within each day, averaged over 14 days. Usually higher priced stocks and higher Beta stocks also have higher ATR while lower priced stocks and lower Beta will have lower ATR. In an ideal example, 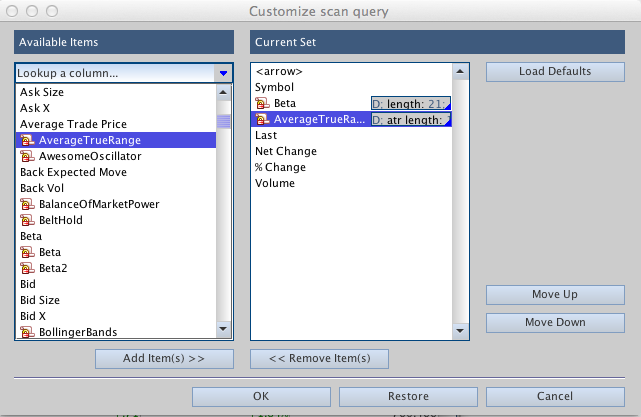 even if closing stock prices each day do not change, there will still be highs and lows and so some stocks will have greater daily ranges than others. To find the ATR, add the column "AverageTrueRange" to your Scan Results. (This is found by clicking the "Symbol" dot on the left of the "Results" display and then selecting "Customize...")
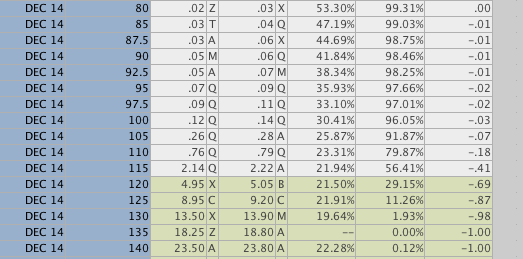
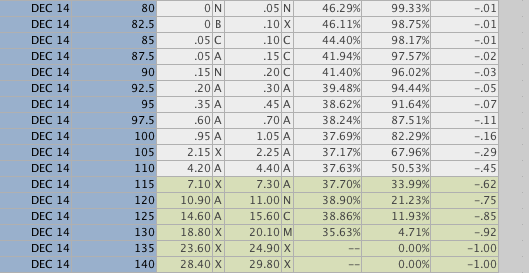
Let's compare two similarly priced stocks, AAPL and BABA. In December of 2014, AAPL (left) has an Beta of .44 but an ATR of about $1.70, while BABA, priced about the same, has a Beta of 0.0 but an ATR of $4.40.
AAPL Put Chain BABA Put Chain
If we put the two December option chains side by side, not surprisingly, we see that BABA kicks out more premium than AAPL. I have chosen the 90% OTM as a point of comparison. As a result, the price on the 90% OTM Put (105 strike for APPL at 91.87%) is .26/.28, but the similar price for the 90% OTM Put (95 strike for BABA at 91.64%) is .35/.45. In other words, if you sell BABA Puts you'll get perhaps 50% more premium (.40 v .27).
Market Make Move (MMM)
A key indicator of potential volatility is the MMM. It measures the built-in volatility reflected in a stock's price pending a news event. For example, if AAPL has a MMM of $8.40, then market makers expect the stock to move up on down by that amount in there near future, usually less than a month. MMM is non-directional, meaning it doesn't say which way the stock is likely to go. You can find it on thinkorswim in the Trade Tab on the same line as stock price IF there is significant event coming up such as company announcement. For more on how to interpret the MMM, go to https://tickertape.tdameritrade.com/amp/tools/market-maker-move-indicator-16084
Strategy Sell wide credit spreads when the ATR or Beta of your stocks exceeds their usual range. Buy back when you have significant profit, usually when volatility has dropped. Remember you are taking on other people's perceived risk of loss (measured by option premiums) so carefully monitor.
In summary, you can calculate and compare the Average True Range, Beta, and Implied Volatility of different stocks before you decide which ones to trade. Remember that recent events affect ATR values more than Beta, which is measured longer-term. These are all a measure of perceived risk, however. In our HOT Trading System, we like stocks with higher ATRs and care a little less about Beta. The happy trader is the one who knows why the premium price is what it is.
There's much more on strategies and volatility on this site. Also check out the many volatility products available from the CBOE, including volatility on the Russell 2000 Index, the NASDAQ and many other high-powered Indexes.
For more on this topic, listen to my recent online seminar "Riding the Wave: How Surfing Makes Better Options Traders".
HOMEWORK: 2 parts
1. We start with a series of 10 multiple choice questions focussed on your understanding of terms such as volatility, Beta, ATR. Check with your class partner if you are unsure about any terms or how to interpret them, or look them up on Investopedia.
2. Now for some trading.
- Find the Beta for these stocks: AAPL, BFAM, SHPG, ICPT, BIDU, ABCO, GWW, WHR, SAM, NFLX, BREW, AMZN.
- Using the Scan function, bring up the list of optionable stocks over 200 and organize them by Last, so they look like this:
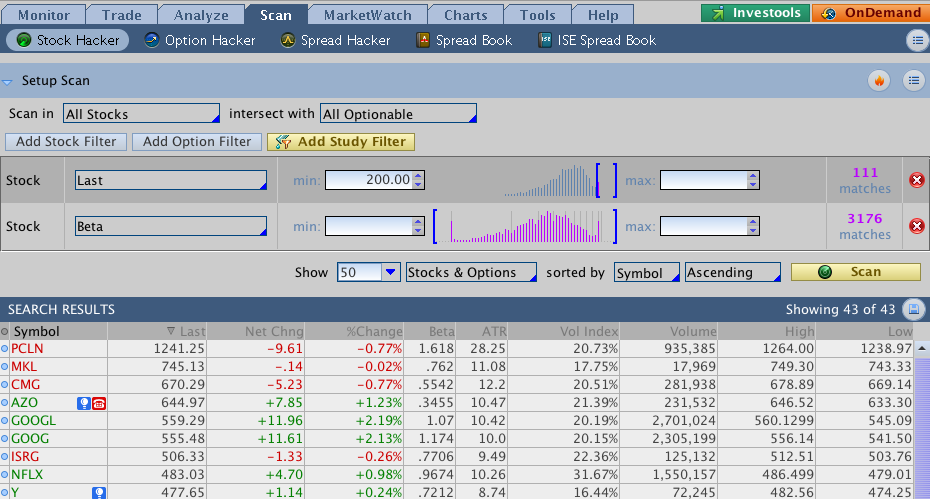
Now click on the Beta column and organize stocks by Beta, then click on ATR to organize by ATR.
Note the top 10 stocks under either category. and place orders to Buy an ATM Call for each, using the current month.
EXAMPLE: Buy +1 Jan 2018 CMG 1st tom Call @ MKT
When filled, place orders to SELL the first OTM Call for each. When both are filled, then place a CLOSING order to SELL the pair as a VERTICAL at a price above the current combined value. To do this you will have to add the price of the ATM call and then subtract the OTM call, and write down the NET cost.
All rights reserved. Copyright 2014-2018 Honolulu Options Traders, LLC
