Imagine a company offered you a job to trade their charity fund with $500,000. But first, "What return should we expect each month?" And "What is your trading plan?"
Most traders do not keep good track of their trades. They only look at the bottom line….how much they have lost, and how much they have left. Its a depressing habit, as you never learn anything worthwhile when fixated on keeping what you have.
But there are many benefits of good record-keeping: You can better judge your wins and losses. You can also re-use the records each earnings season, cutting down valuable set-up time. You can better evaluate your strategies and improve your profitability. Know your strengths and weaknesses! Finally, your tax return will need to accurately reflect your true profits, along with supportive documentation.
In the HOT Trading System, we keep daily, monthly and annual record of all trades and quarterly and yearly totals of profits and losses. Notice I said Profits AND Losses!
In this blog I will show how to set up your records and how to use them to improve as a trader. There are two kinds of records you need to have: access to your thinkorswim records, and your own spreadsheet.
1. Make a daily screenshot of your desktop or current trades. For Mac users, this is Command-Shift-3 and for PC users there are several ways to do it. You can also use the “Preview” program selecting File/TakeScreenShot and then select choosing Selection, Window or Entire Screen. Make a desktop folder for the year containing screenshots arranged by date.
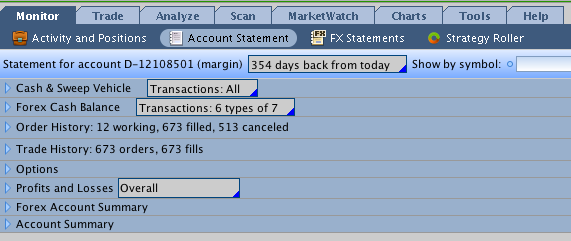
2. Find and copy your thinkorswim records every year. As you are trading PaperMoney only, you will not receive statements from TDAmertitrade. However, the thinkorswim platform keeps record of all your trades, for about one calendar year. You can find them by going to Monitor/AccountStatement/ There you will see this:
Here’s what these sub-sections provide:
- Cash&Sweep List of the cash effect of all trades, with date and time stamp.
- Order History Every order you placed, whether Working, Filled, Expired, Rejected, or Triggered. These can arranged by symbol, date, type of order, etc.
- Trade History Every trade you entered, showing debits, credits, etc.
- Options contains only currently open trades. Not relevant until trades are closed.
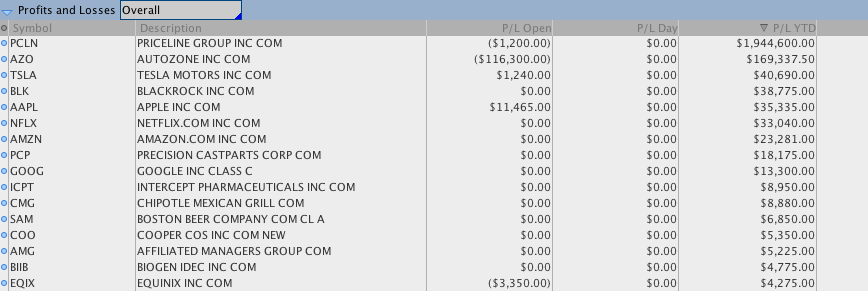
- Profits and Losses This is a very important record, as it organizes your activity by underlying stock and shows you how you are doing for the year. You can click the column to arrange by Profits or Losses. You will see that for this account, options on PCLN, AZO, TSLA, BLK were the most successful and the account lost money on options for BIDU, PXD, GWW and others. [click to enlarge]
- Account Summary The last lines of the report include your totals for the year, including commissions.
For this account, commissions were about $16,586, or about 4% of net profit. Try to keep your commission under 5% of your yearly net. In a future post, I will explain some ways to keep commission costs down.
SUMMARY OF RESULTS So, how well did you did this last month, quarter and year? In this demonstration account of 2014 we traded 49 underlying stocks and made money on 41 / 49 for the year. (Notice how small the losses were compared to the winning trades.) That’s about 80% successful trades, and matches the goals for the HOT Trading System.
VERY IMPORTANT Your PaperMoney trades will disappear after a year, so make sure to archive your screenshots for future reference, track record, etc.
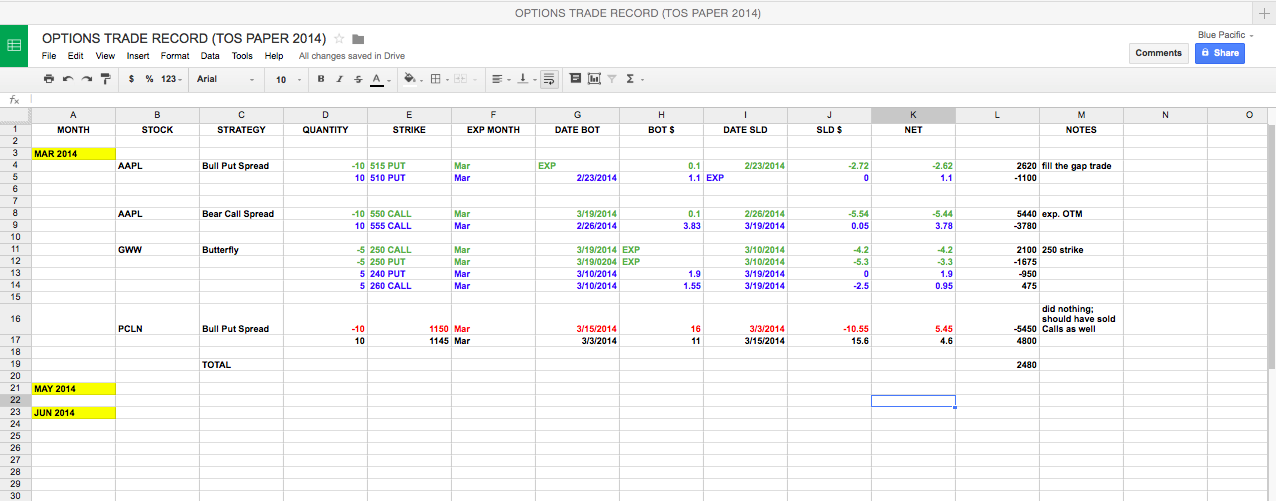
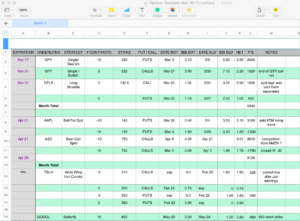
3. Keep a spreadsheet of all your trades, updated whenever you open or close a trade. Here’s how to set it up… [click to enlarge]
The first column is for expiration months, highlighted in YELLOW. The second is for underlying stock. Place all trades for the month together, regardless of when you opened or closed the trade. This way you can keep track of how you are doing for the month. Using the Order History in your thinkorswim, you will enter the dates and numbers for each and every trade. If an option expires OTM, then its value will be 0 (zero). The color code I use is as follows…
- GREEN means a credit
- GREY means an insurance buy
- BLUE means a debit
- RED means a loss on the overall transaction.
There may be better ways to do all this, and you are welcome to share your ideas in the response section.
========================================================================
So here's HOMEWORK
1. Make a new desktop folder and place in it all the daily screen shots for the year so far.
2. Make another folder and place in it a screenshot of your Trade History and all your Profit and Losses for YTD.
3. Calculate your % of wins/losses for the year so far.
4. Set up reminders in your Calendar to review your trades each month and quarter, and keep a % tally of your wins and losses.
5. Share your track record with your trading partner or others. Its only PaperMoney, after all.
All rights reserved. Copyright 2014-2015 Graeme Sharrock and Honolulu Options Traders, LLC


